Maps 0.x
Flat maps of round bodies, the tiles web maps serve them in, and what an elevation grid says about the ground. These functions are in @interstellar-tools/maps, which is still 0.x: its API may change in a minor release.
npm i @interstellar-tools/mapsThe examples are on Mars, and every number on this page is checked by a test. Like the rest of Interstellar Tools, the functions take angles in radians and lengths in metres.
import type { Radians } from '@interstellar-tools/types';

const toRad = (deg: number) => ((deg * Math.PI) / 180) as Radians;
const toDeg = (rad: number) => (rad * 180) / Math.PI;
const R = 3_396_190; // Mars's equatorial radius, m
Choose a projection
No flat map keeps everything a globe shows. A conformal projection keeps angles, so small shapes look right, but stretches areas. An equal-area projection keeps areas, but shears shapes. Pick the property the map is for:
| Projection | Keeps | Good for |
|---|---|---|
| Mercator | Angles | Web maps and tiles, navigation |
| Equirectangular | Distances along meridians | Global mosaics and elevation models |
| Sinusoidal | Areas | Global mosaics where area counts |
| Mollweide | Areas | Whole-sphere maps, sky surveys |
| Lambert azimuthal equal-area | Areas, and directions from the centre | Hemispheres and polar regions |
| Stereographic | Angles, and directions from the centre | Polar caps |
| Orthographic | Directions from the centre | Globe views: a planet as it looks from far off |
Each is a function of the same name: mercator, equirectangular, sinusoidal, mollweide, lambertAzimuthalEqualArea, stereographic and orthographic.
Below, every map has a graticule every 30° and Tissot's circles: circles of the same size on the sphere, 12° across. Where a projection stretches, they grow; where it shears, they turn into ellipses. On a conformal map they stay round; on an equal-area map they keep their area.
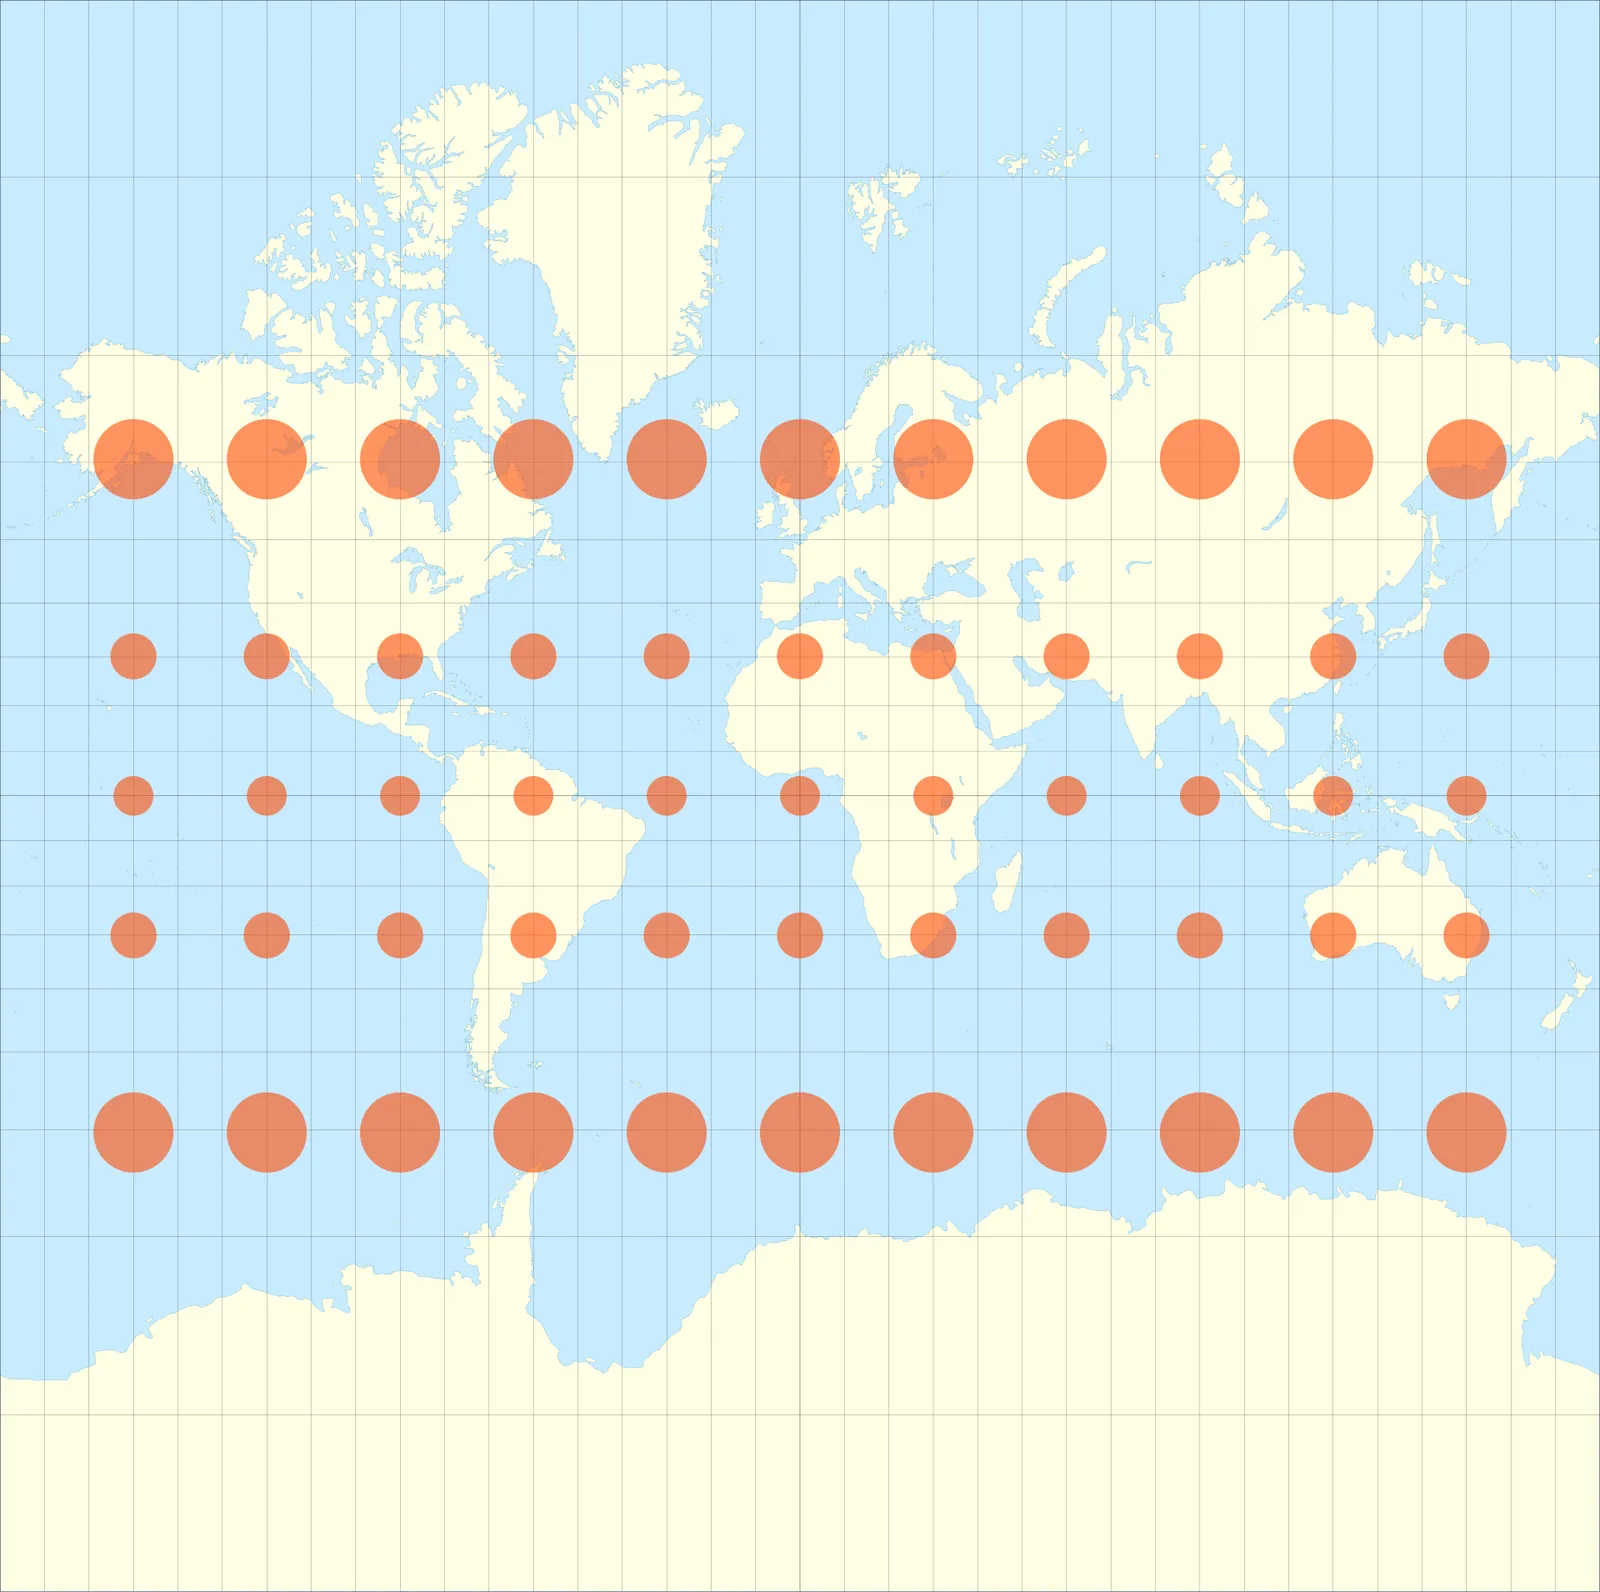
Tissot's circles on a Mercator map of Earth. They grow towards the poles, which is why Greenland looks as large as Africa, 14 times its area.
Each projection has an inverse, inverseMercator, inverseEquirectangular and so on, from a point on the map back to latitude and longitude. Here is Perseverance's landing site, at 18.4447° N, 77.4508° E, on the equirectangular map most Mars mosaics use, and on Mercator:
import {
  equirectangular,
  inverseEquirectangular,
  mercator
} from '@interstellar-tools/maps';

const site = [toRad(18.4447), toRad(77.4508)] as const;

equirectangular(...site, R); // ≈ { x: 4 590 873, y: 1 093 304 } m
inverseEquirectangular(4_590_873, 1_093_304, R); // ≈ 18.4447° N, 77.4508° E
mercator(...site, R); // ≈ { x: 4 590 873, y: 1 112 692 } m
The same x, but Mercator puts the site 19.4 km further north: it stretches north–south as much as east–west, to keep angles.
The azimuthal projections are centred on a point, phi0 and lambda0, and show directions from it truly. A polar stereographic map of Mars's north polar cap, and Curiosity's landing site as seen on a globe centred on Jezero:
import { orthographic, stereographic } from '@interstellar-tools/maps';

// 5° from the pole: 296.6 km away, 0.2% larger than on the globe
stereographic(toRad(85), toRad(0), R, { phi0: toRad(90) });
// ≈ { x: 0, y: −296 562 } m

orthographic(toRad(-4.5895), toRad(137.4417), R, {
  phi0: toRad(18.4447),
  lambda0: toRad(77.4508)
});
// ≈ { x: 2 931 487, y: −793 474 } m: east, and a little south
Points a map can't show
Mercator can't show the poles, which are infinitely far away. Stereographic can't show the point opposite its centre, Lambert gives that point no single place, and orthographic hides the far side. These throw a RangeError, as does an inverse given a point off the map. Longitudes come back in (−180°, 180°].
Serve tiles
Web maps load a map as square tiles in spherical Web Mercator. At zoom x count east from 180° W, and rows y count south from the top of the map, at 85.05° N. This is the XYZ scheme of OpenStreetMap; the same tiles work for any body, since they depend only on angles.
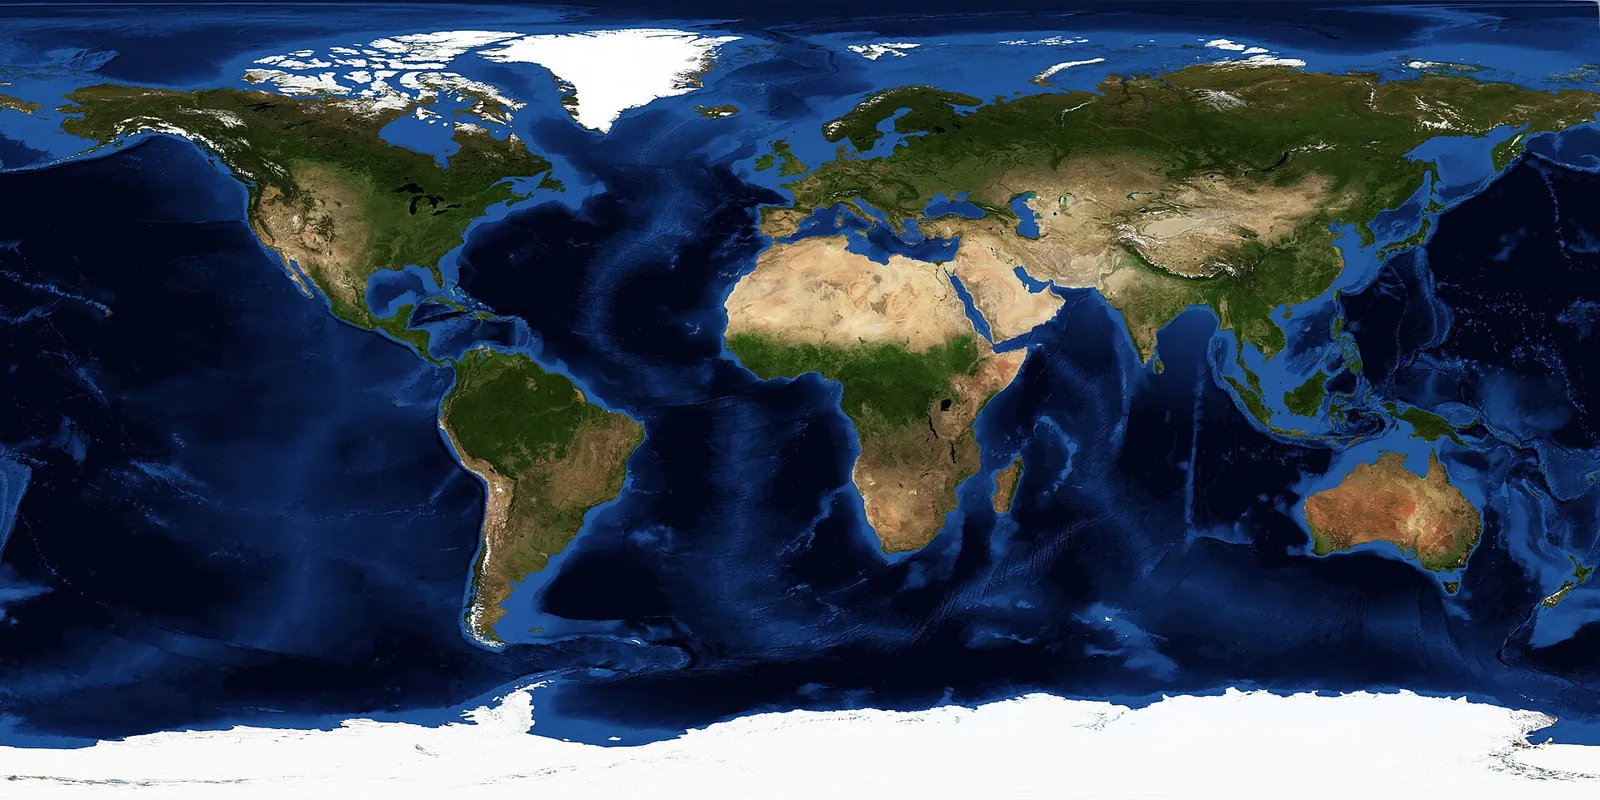
Earth in equirectangular projection, the usual layout for a whole-planet image. Tiles are cut from images like this after they're reprojected to Web Mercator.
A quadkey names a tile with one digit 0–3 per zoom level, for the quarter of its parent it is in, so a tile's key starts with its parent's:
1 and then 12. Digits 0 and 2 are the western half, 0 and 1 the northern.import { quadkey, tileAt, tileBounds } from '@interstellar-tools/maps';
const tile = tileAt(toRad(18.4447), toRad(77.4508), 6);
// { x: 45, y: 28, z: 6 }
quadkey(tile.x, tile.y, tile.z); // '123301'
tileBounds(tile.x, tile.y, tile.z);
// ≈ 16.64° N to 21.94° N, 73.125° E to 78.75° E, in radiansAt zoom 6 a tile is fromQuadkey goes from a key back to the tile, and latitudes beyond 85.05° land in the top or bottom row.
Terrain from an elevation grid
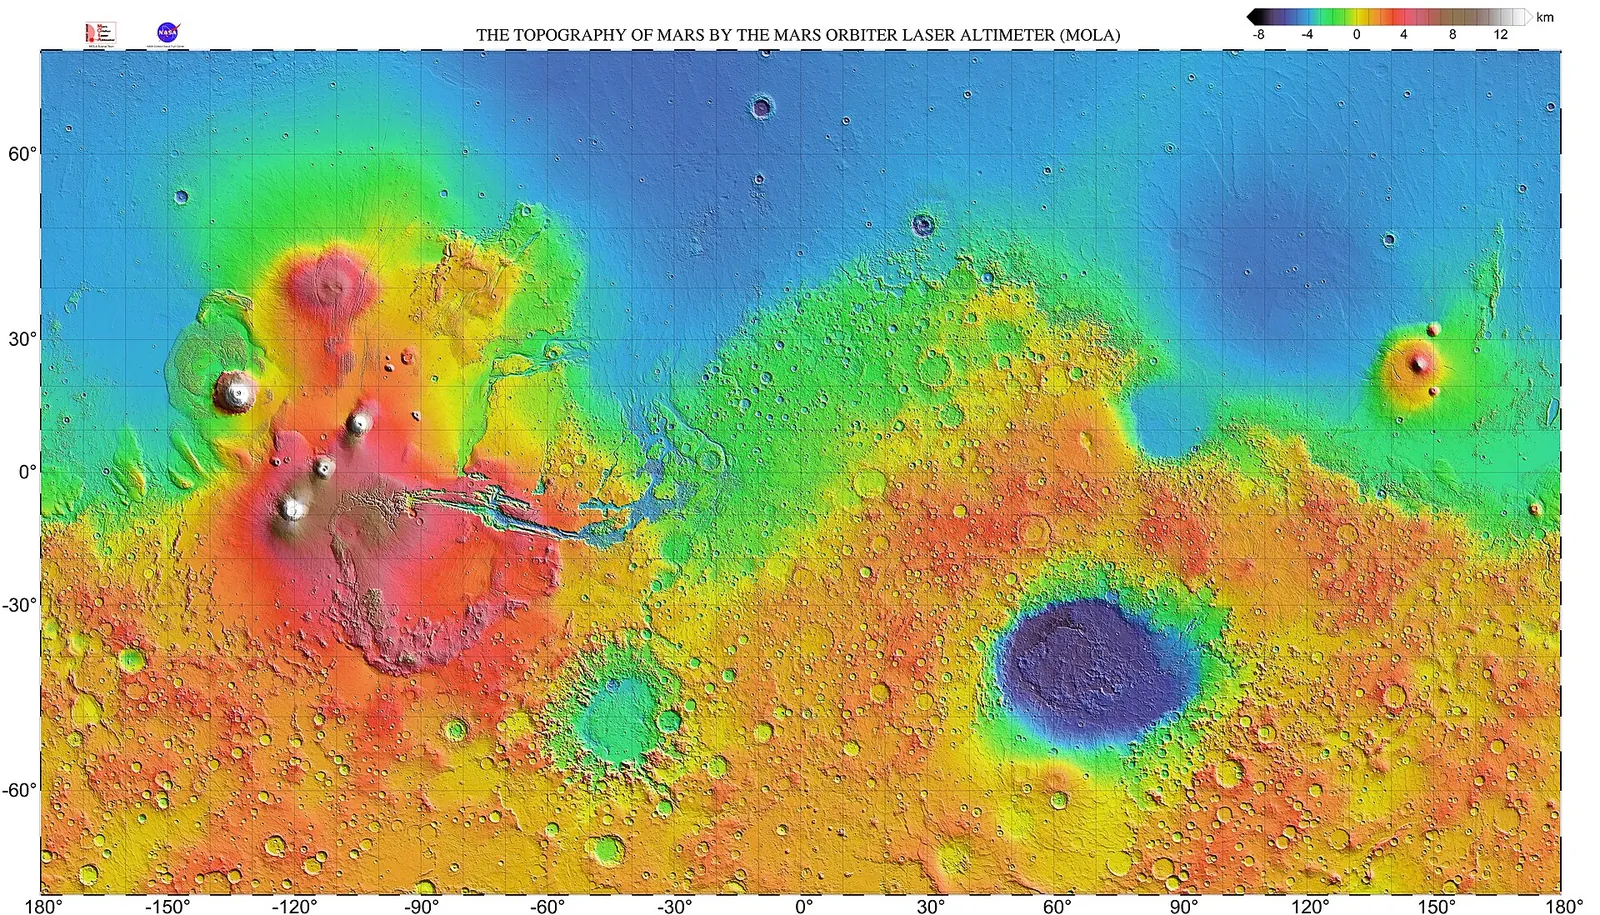
Mars from the MOLA laser altimeter: a global elevation grid, from the floor of Hellas basin, about 8 km below the datum, to Olympus Mons, about 22 km above it.
A digital elevation model is a grid of heights. createGrid checks one and holds it: row 0 is the northernmost, columns run west to east, and every cell is the same size in metres. Here is a patch of ground 5 m by 5 m, at 1 m a cell: a slope rising 0.1 m per metre to the east, with a 0.4 m boulder on it.
import { createGrid } from '@interstellar-tools/maps';

const values: number[] = [];

for (let row = 0; row < 5; row++)
  for (let column = 0; column < 5; column++)
    values.push(0.1 * column + (row === 1 && column === 3 ? 0.4 : 0));

const grid = createGrid({
  rows: 5,
  columns: 5,
  values,
  cellSize: { x: 1, y: 1 }
});
Most terrain functions read a cell's 3 × 3 neighbourhood, and come as an …At version for one cell and a …Grid version for the whole grid. Cells on the edge have no full neighbourhood, so they come back as NaN.
Slope, aspect and shading
import { aspectAt, hillshadeAt, slopeAt } from '@interstellar-tools/maps';

const slope = slopeAt(grid, 3, 2); // ≈ 5.71°, the steepest way down
const aspect = aspectAt(grid, 3, 2); // 270°: it faces west, downhill

hillshadeAt(slope, aspect, toRad(270), toRad(30)); // ≈ 0.58, Sun in the west
hillshadeAt(slope, aspect, toRad(90), toRad(30)); // ≈ 0.41, Sun in the east
Aspect is a compass bearing, clockwise from north. The hillshade is the brightness of the ground under a Sun at that azimuth and elevation, from 0 to 1: the slope faces a western Sun, so it's lit better than flat ground, at
Roughness and curvature
The Terrain Roughness Index is how much a cell's neighbours differ from it, in metres. The curvature is how the slope bends, in 1/m: positive where the ground is convex, a crest or a boulder, and negative in a hollow.
import { curvatureAt, terrainRoughnessIndexAt } from '@interstellar-tools/maps';

terrainRoughnessIndexAt(grid, 3, 2); // ≈ 0.087 m, the slope itself
terrainRoughnessIndexAt(grid, 1, 3); // ≈ 0.41 m, on the boulder

curvatureAt(grid, 1, 3); // ≈ { profile: 0.79, planform: 0.80 } per m, convex
curvatureAt(grid, 3, 2); // { profile: 0, planform: 0 }: a plane doesn't bend
Where to land
safeLandingGrid puts these together for a lander: a cell is safe where the lander stays upright on its slope and the ground is no rougher than its clearance. This lander tips over at
import { safeLandingGrid } from '@interstellar-tools/maps';

const safe = safeLandingGrid(grid, {
  rFootprint: 1.0, // m, from the centre of mass to the tipping edge
  hCoM: 0.8, // m, height of the centre of mass
  maxRoughness: 0.3 // m
});
// ·  ·  ·  ·  ·
// ·  1  1  0  ·    the boulder: too rough
// ·  1  1  1  ·
// ·  1  1  1  ·
// ·  ·  ·  ·  ·    · is NaN: no full neighbourhood
A mask like this is a first screen, not a landing decision: pick a cell about the size of the lander's footprint, since boulders smaller than a cell don't show.
Water
On bodies with running water, now or in the past, the same grid shows where it would flow. flowDirections sends each cell to its steepest lower neighbour, flowAccumulation adds up the area that drains through each cell, and topographicWetnessIndex combines that area with the slope: high where water collects, in valley floors and hollows.
Next
- Geodesy: distances, heights and areas on the sphere and the ellipsoid, before you project them.
- The maps reference has every function, with its formula, units and limits, and the imaging and landing functions this page doesn't cover.