home projects speaker

WebGL and Data Visualisation

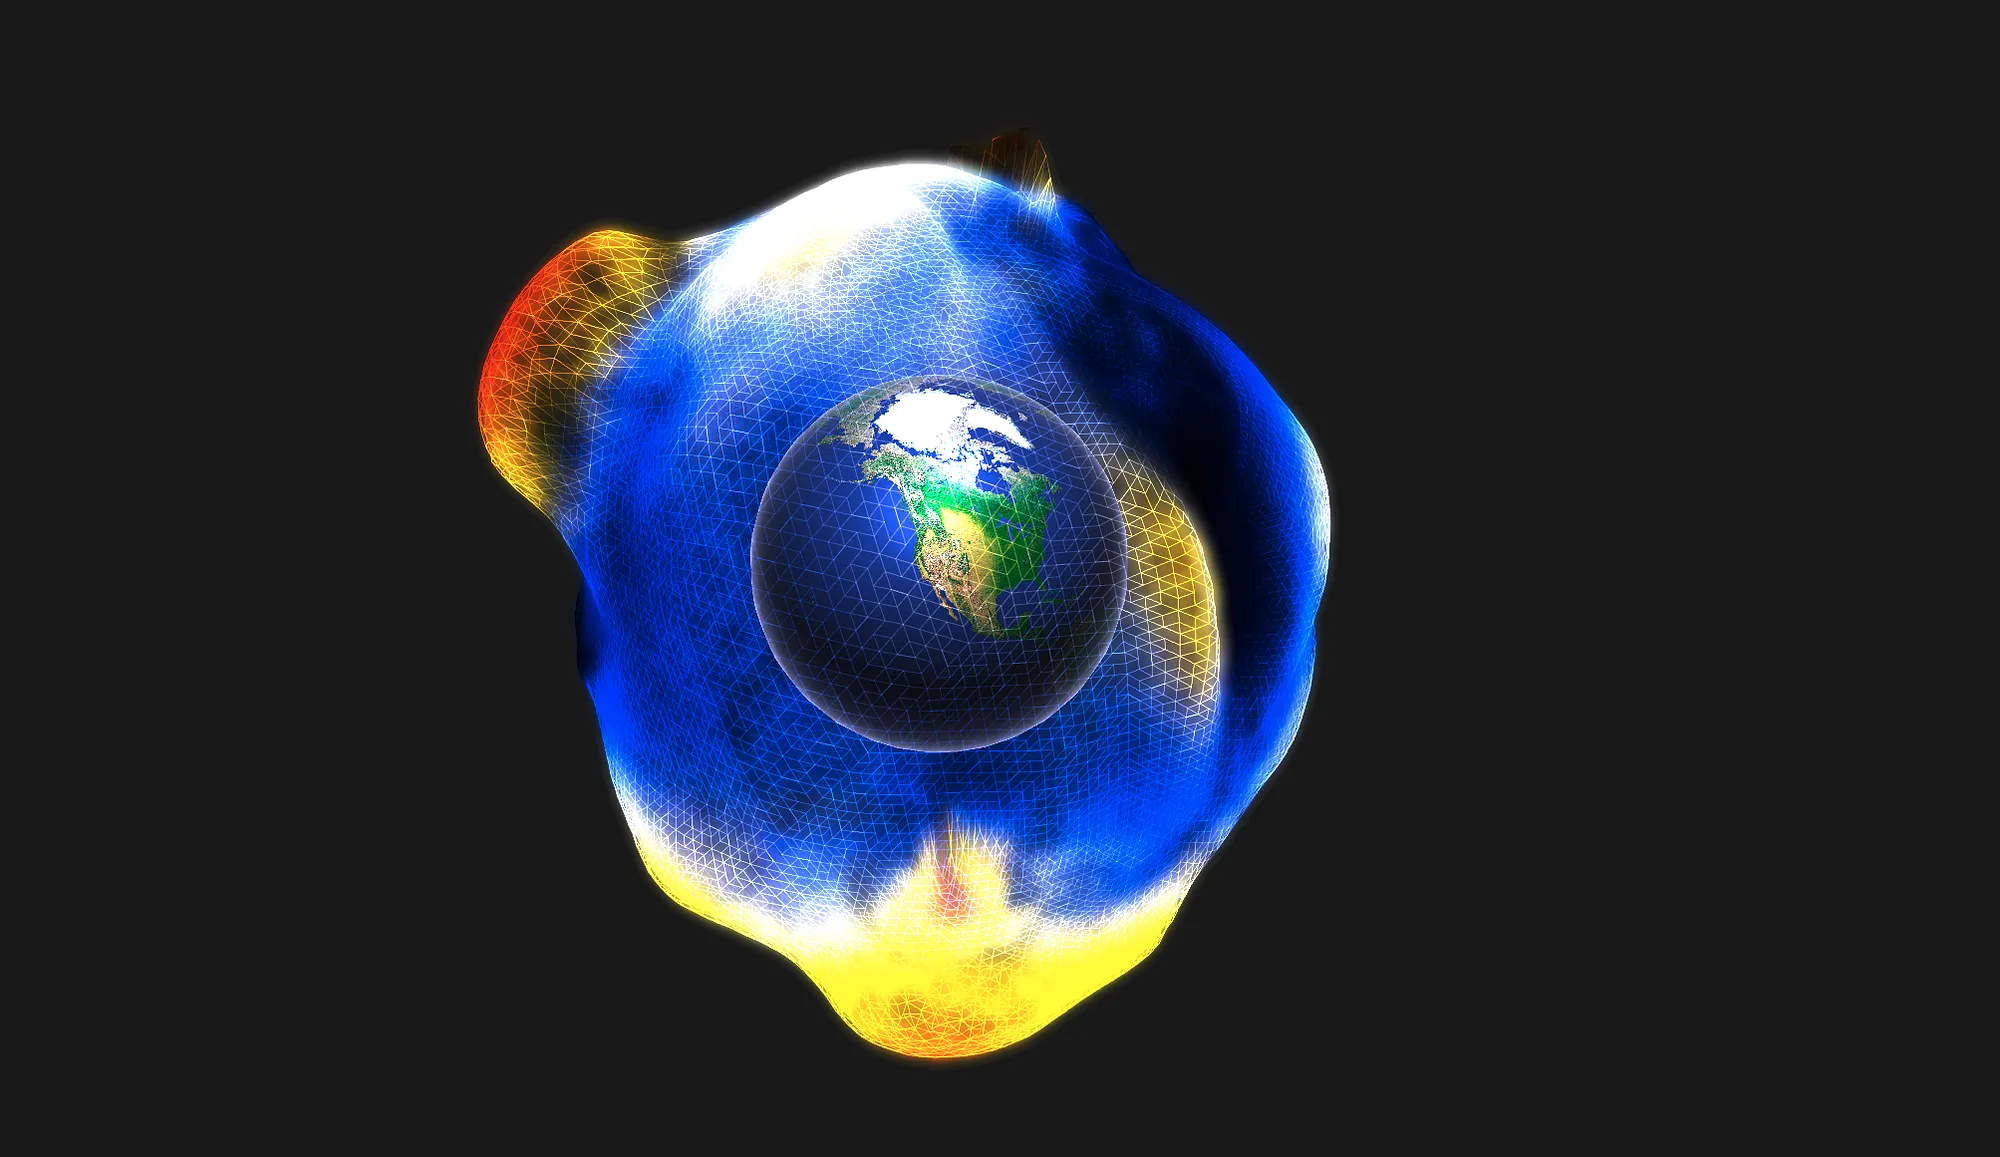
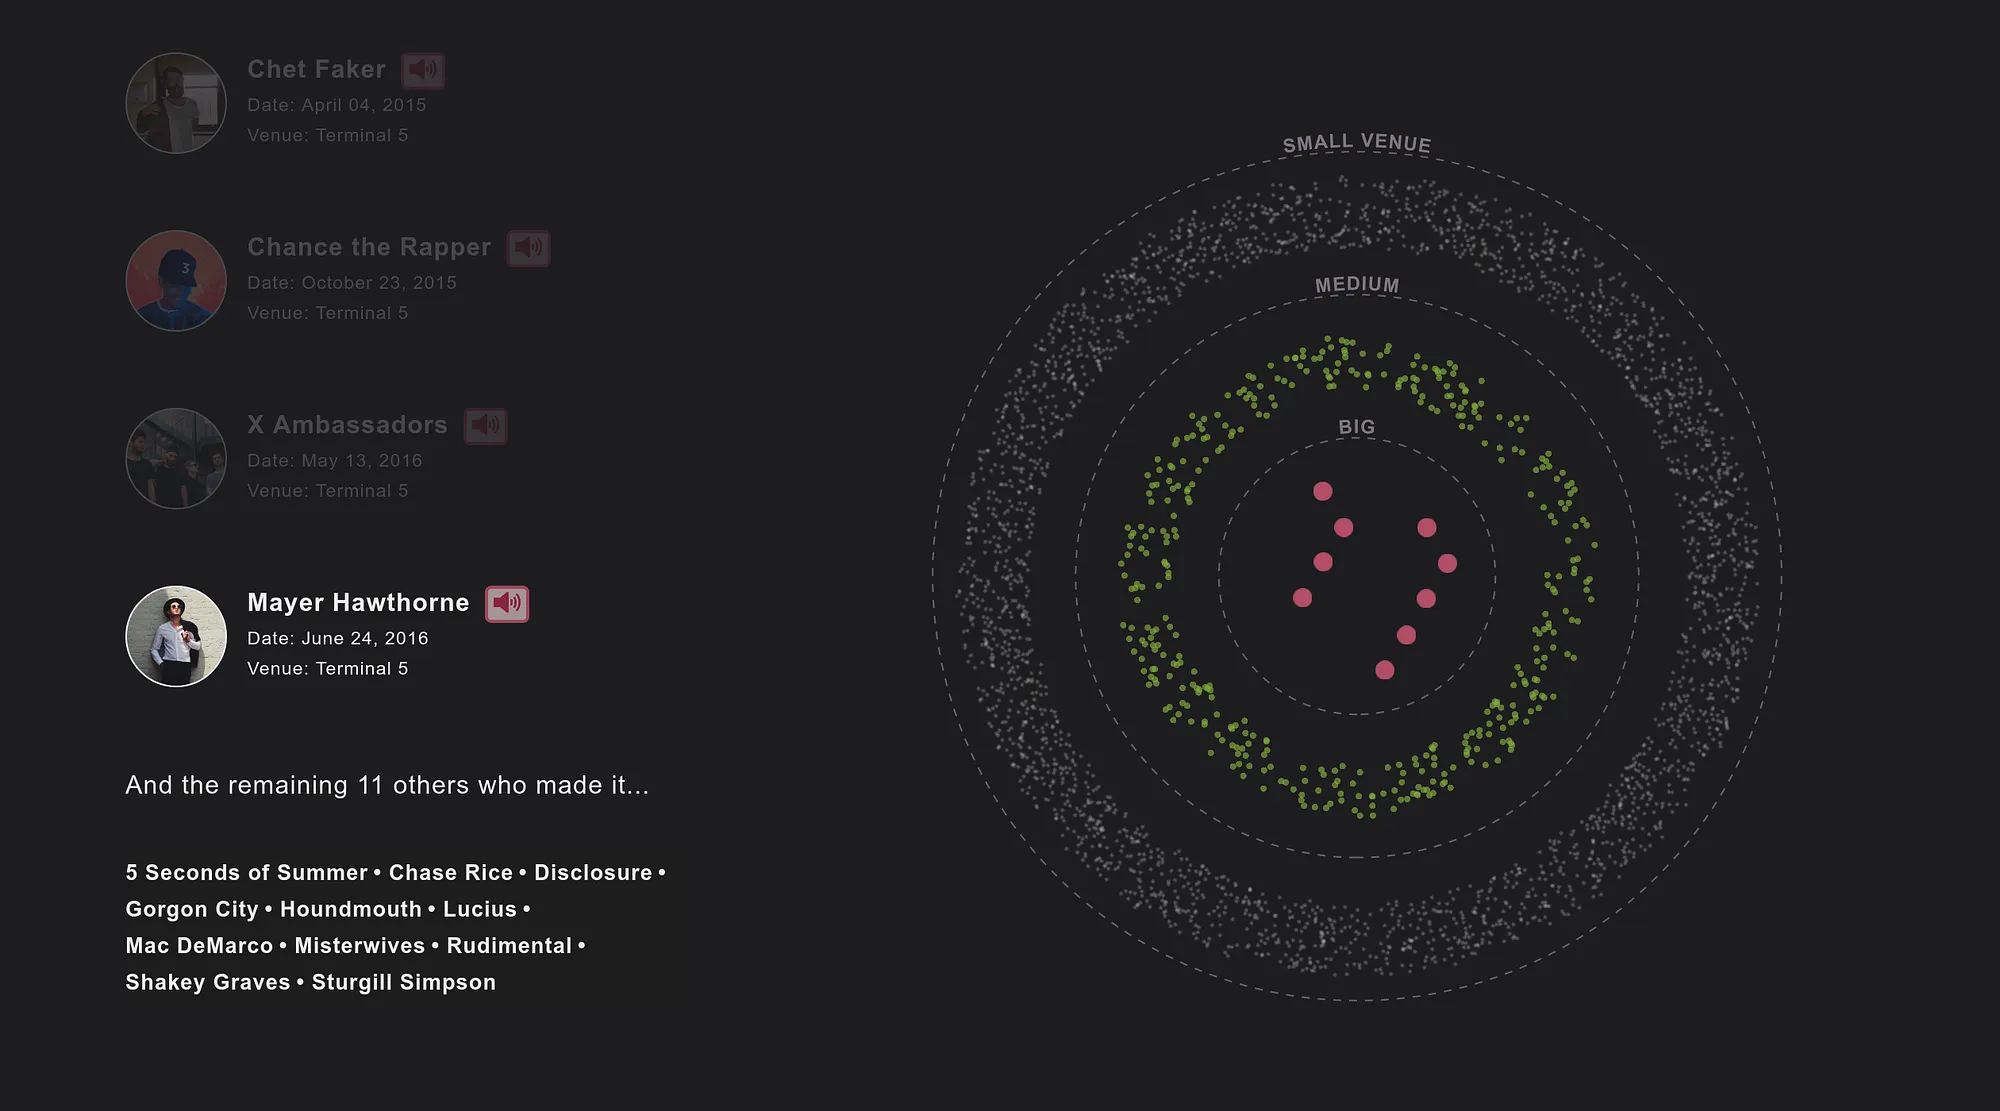
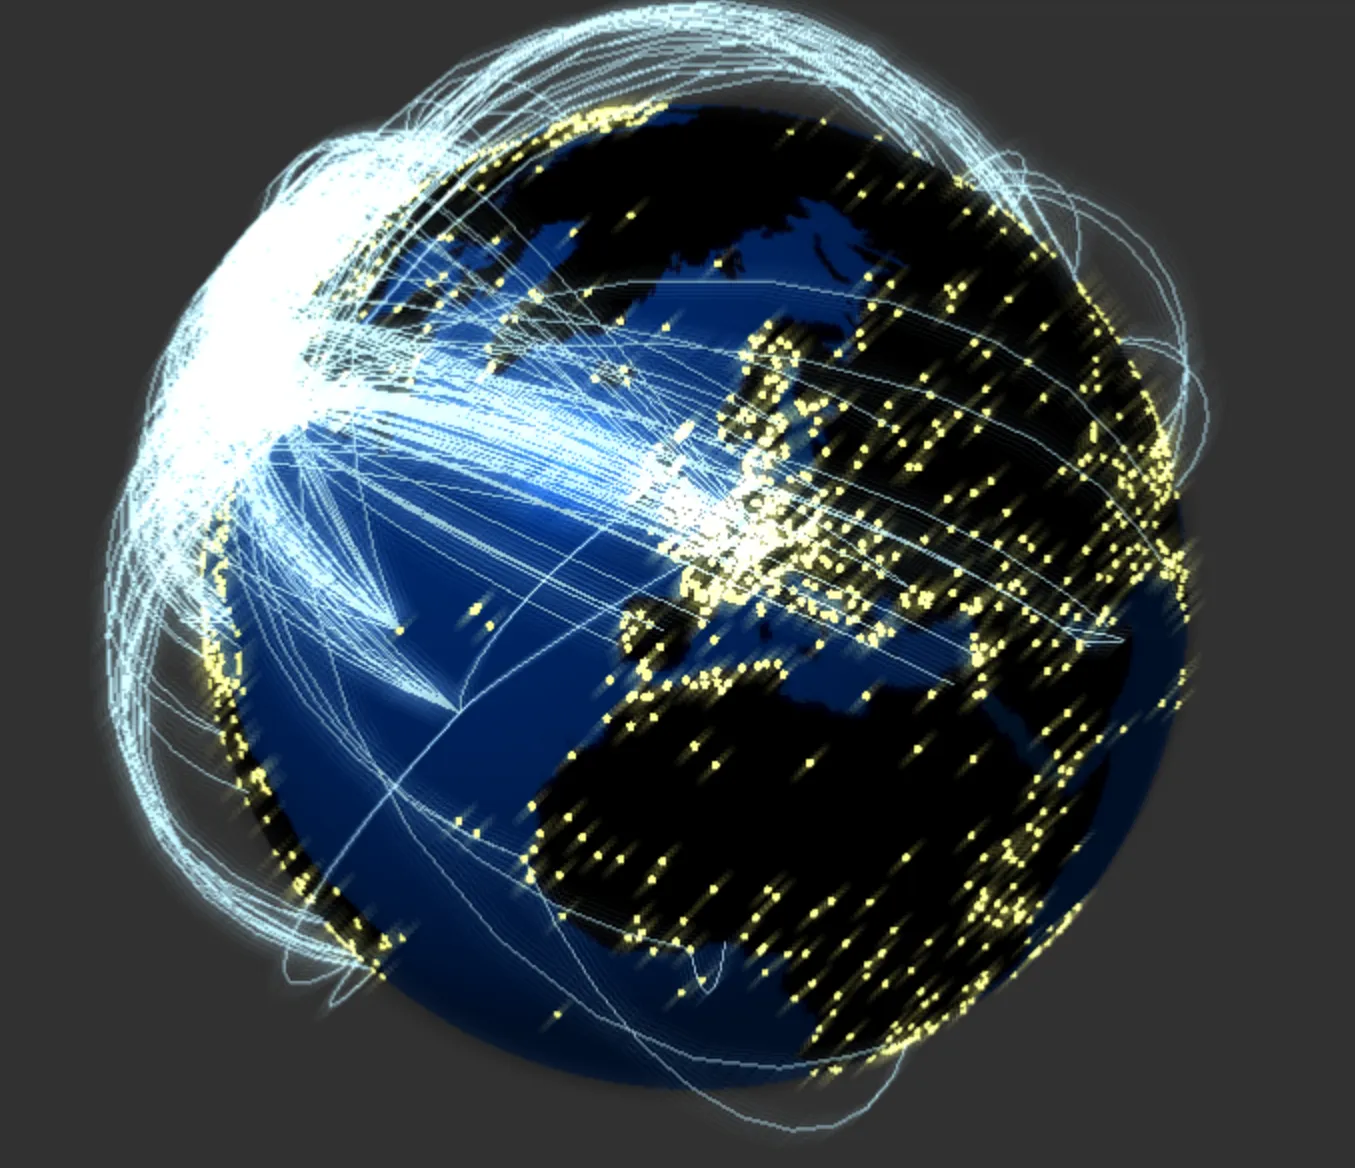
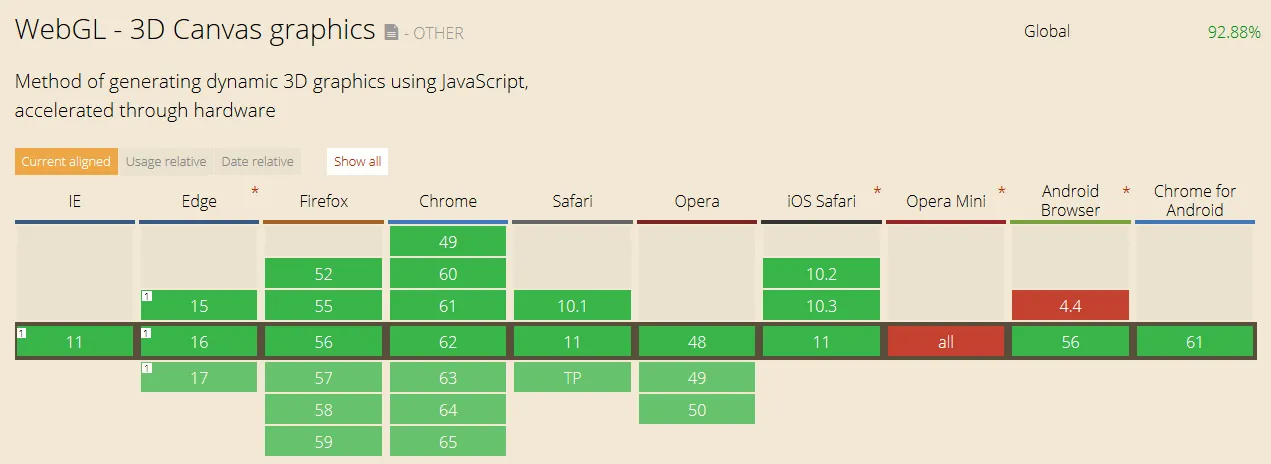
Have you ever wondered how you can give those statistical data a bit more depth, give those graphs a whole new dimension or make scientific results more understandable? Fear not, WebGL is the tool for you!

Table of Contents

  1. What is WebGL?
  2. Why use WebGL?
  3. Why should I care about WebGL?
  4. What is it actually good for?
  5. What are the drawbacks of using WebGL?
  6. Well, I have my charts
Note

This article aims to try to explain the reasons why you should use WebGL, and especially, why you should amp up your data visualizations with WebGL. This is meant to be more of an introduction to WebGL and data visualization, instead of a how-to. YMMV.

What is WebGL?

WebGL is a graphical library with a JavaScript API used to create interactive 3D and 2D graphics within any compatible browser.

WebGL gives you access to hardware accelerated graphics via the HTML5 Canvas element.

Why use WebGL?

Normally when rendering dynamic images in the browser, the go-to solution was using Canvas, in 2D, like a bitmap. And with the complexity in certain dynamic images, the bitmap created on the Canvas uses a lot of CPU. With WebGL, the GPU is used for the computationally expensive process, instead of the CPU.

Why? Well, we could answer it with one question: Why use OpenGL?

  • Cross Platform API
  • Can be utilised in several industries (Entertainment, Medical, Military) (3D modelling, applications, games)
  • Cross Device (mobile phones, consoles)

So, you can use WebGL to make cool stuff in the browser!? Well, yes. Due to the “no plugins needed”-point, the wide support for WebGL and that the workhorse for graphics in the browser is no longer the CPU.

Why should I care about WebGL?

Even if you don’t use WebGL, you should know that the impact of WebGL isn’t always about cool stuff in the browser.

  • Developing WebGL applications/features requires some muscle, and thanks to the importance of WebGL, browser vendors have improved the ECMAScript speed substantially.
  • Browsers have gotten better garbage collection partly as a result of WebGL.
  • Since this is a web technology, everybody has been working very hard to push graphics hardware vendors and OEMs for better drivers.

What is it actually good for?

So you want a list of cool things it can do, eh?

  • Augmented reality applications
  • Games
  • Real-time data visualizations
  • Maps
  • 3D printing
  • Virtualization
  • Image processing

The real world usage for WebGL is boundless…

What are the drawbacks of using WebGL?

Allthough the 3D graphic computations required for WebGL is leveraged to the GPU, the computations has to be, well, written. If you are to write your WebGL code from scratch, without the aid and help of frameworks, you might want to brush up on your Advanced Mathematics 101.

In reality, WebGL is just a rasterization engine. It draws the points and lines you supply it with.

The code example below is one of the first versions we used to draw the rings and the radar sweep at https://radar.bekk.no/tech2017:

javascript
const vertexSource = `
precision highp float;
attribute vec2 a_position;
varying vec2 v_uv;
uniform float u_aspect;
uniform float u_scale;

void main(void) {
  v_uv = vec2(a_position.x, a_position.y / u_aspect) / u_scale;
  gl_Position = vec4(a_position, 1.0, 1.0);
}
`;

const fragmentSource = `
precision highp float;
varying vec2 v_uv;
uniform float u_aspect;
uniform float u_time;
uniform float u_numRings;

float rings(float dist) {
  float t = 0.004 * u_time;
  float s = -t+dist*u_numRings*3.1415*2.0;
  float combined = cos(s);
  float edge = smoothstep(0.95,1.0,combined);
  return clamp(edge-dist * 0.5, 0.0, 1.0);
}

float sweep(float radian) {
  float t = 0.00005 * u_time; //we need precision highp, because of this
  radian = (1.0 - radian) / (3.1415*2.0);
  radian -= t;
  float antiAlias = mod(-radian,1.0);
  antiAlias = smoothstep(0.997,1.0,antiAlias);
  radian = mod(radian, 1.0);
  radian = smoothstep(0.85, 1.0, radian);
  radian = radian * radian;
  return antiAlias + radian;
}

void main() {
  float radian = atan(v_uv.y, v_uv.x);
  float distSqr = v_uv.x * v_uv.x + v_uv.y * v_uv.y;
  float dist = sqrt(distSqr);
  float ring = rings(dist) * 0.175;
  float sweep = sweep(radian) * 0.125;
  gl_FragColor = vec4(vec3((ring+sweep)), 1.0);
}
`;

function compileShader(gl, source, type) {
  const shader = gl.createShader(type);
  gl.shaderSource(shader, source);
  gl.compileShader(shader);
  if (!gl.getShaderParameter(shader, gl.COMPILE_STATUS)) {
    throw `Could not compile shader: ${gl.getShaderInfoLog(shader)}`;
  }
  return shader;
}

function compileVertexShader(gl, source) {
  return compileShader(gl, source, gl.VERTEX_SHADER);
}

function compileFragmentShader(gl, source) {
  return compileShader(gl, source, gl.FRAGMENT_SHADER);
}

function linkProgram(gl, vertexShader, fragmentShader) {
  const program = gl.createProgram();
  gl.attachShader(program, vertexShader);
  gl.attachShader(program, fragmentShader);
  gl.linkProgram(program);
  if (!gl.getProgramParameter(program, gl.LINK_STATUS)) {
    throw `Program failed to link: ${gl.getProgramInfoLog(program)}`;
  }
  return program;
}

function setUnitQuad(gl) {
  gl.bufferData(
    gl.ARRAY_BUFFER,
    new Float32Array([
      -1.0, -1.0, +1.0, -1.0, -1.0, +1.0, -1.0, +1.0, +1.0, -1.0, +1.0, +1.0,
    ]),
    gl.STATIC_DRAW,
  );
}

There are several frameworks out there to help you with this. For both WebGL and OpenGL. Yes, you heard that right. You can get a 3D artist/designer/animator to generate the vertex/shader code for you to use in your WebGL application. Or you can use existing models from games, like World of Warcraft, which they’ve done in this demo: http://vjeux.github.io/jsWoWModelViewer/.

The computations, although on the GPU, still has to be run, and for some implementations of WebGL, this can be a resource hog.

Albeit the mathematics and resource hog could be a drawback, from my point of view, the rewards outweighs this hundredfolds.

Okay, but how can I use WebGL to put the “wow” in my data visualizations?

Well, I have my charts

Yes, there are several libraries available today for generating data visualizations on the web (charts, graphs, plotlines et al): D3.js InfoVis, Springy.js, Ember Charts, HighCharts, Raphael.js. The list is extensive and long, and you’ve probably heard of or used at least one of those libraries. But none of those libraries really pack that final “POW” to the graphical part of data visualizations.

With WebGL, you can put more depth and meaning to your data. It allows you to present and relay the information from different perspectives.

You can give more effect to your visualisation, giving more context to the information extracted of the data.

Visual representations of data aim to exploit human intuitive ability to recognise structure and patterns. This can be important to get a comprehensive overview of data so that you can benefit from it.


About the author

Hi! My name is Alexander, and I am a creative frontender, specializing in UX, accessibility, universal design, frontend-architecture, node and design systems. I am passionate with open source projects and love to dabble with new emerging technologies related to frontend. With over 24 years of frontend experience, I have earned the right to be called a veteran. I am a lover of life, technologist at heart. If I am not coding, I am cooking and I love whisky and cigars. Oh, and coffee, I LOVE coffee!

If you want to know more about me, here is some links you might want to check out: GitHub, Instagram, Twitter, LinkedIn, CodePen, Slides.com, npm,

Speaker

I am also an avid speaker on several topics! Check out some of the things I speak about, and contact me if you are interested in having me at your next event!